Commodities Portfolio – Week 7


Metals Continue Leading While Traditional Energy Remains Under Pressure
The commodities portfolio recovered slightly during Week 7, rising to $103,192.39 and bringing total performance to +3.2% since inception versus +4.1% for DBC. Even though the portfolio still trails the benchmark slightly, the internal rotation across commodity groups is becoming much clearer after nearly two months of tracking.
What stands out most right now is the growing divergence between traditional oil exposure and metals related names.
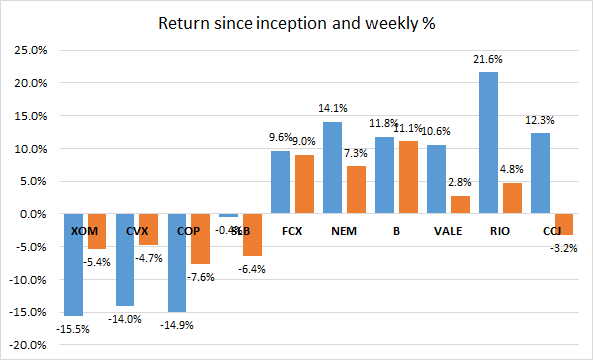
Oil majors and upstream energy companies remained under pressure again this week. XOM declined to -15.5%, CVX fell to -14.0% and COP dropped to -14.9% since inception. Crude prices continue struggling with slowing global demand expectations and concerns around oversupply, keeping pressure across the integrated energy complex.
Meanwhile, metals and mining exposure continue behaving materially better. RIO remains the strongest position in the portfolio at +21.6%, while CCJ advanced to +12.3%, NEM climbed to +14.1% and VALE reached +10.6%. Copper exposure through FCX also recovered strongly and is now back to +9.6%.
That separation matters because the market is increasingly rewarding commodities tied to electrification, infrastructure, uranium and precious metals while remaining far more cautious on traditional oil exposure.
The divergence between weekly performance and total return is becoming increasingly important. Several energy names continue deteriorating both weekly and since inception, while metals related positions maintain much stronger relative momentum despite broader commodity volatility.
Gold miners also recovered materially this week. NEM and Barrick both rebounded as investors rotated back toward defensive hard asset exposure following renewed volatility across global equities and rates markets.
At the same time, uranium exposure through CCJ continues acting as one of the strongest structural themes inside the portfolio. Even after some short term consolidation, the position still remains among the best contributors overall.
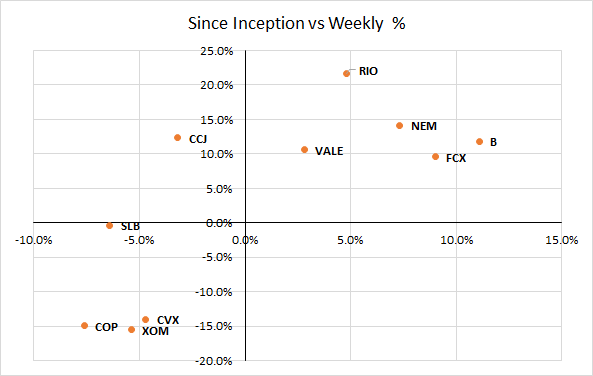
The scatter chart highlights that separation very clearly. Traditional energy names cluster deep into negative territory, while mining, uranium and metals related companies remain concentrated in the upper right side of the chart with both positive weekly momentum and positive returns since inception.
One important detail also needs to be clarified when comparing the portfolio against DBC. The benchmark itself has broader diversified commodity exposure and less concentration in individual equity volatility. Meanwhile, this portfolio intentionally focuses more aggressively on commodity producers and operational leverage, which naturally increases dispersion between winners and losers.
That explains why the portfolio can temporarily underperform despite several positions posting very strong absolute returns.
At this point, the portfolio is starting to reveal much clearer structural leadership trends underneath the surface. Oil continues lagging… Metals, uranium and mining continue leading.
And honestly, that probably reflects where investors currently see the strongest long term demand visibility globally.
For now, the strategy itself remains unchanged because the objective is still weekly monitoring using simultaneous entry prices rather than actively rotating every short term move.
But after nearly two months of data, the next stage will likely focus much more heavily on internal commodity rotations, factor leadership and whether traditional energy exposure deserves lower weight relative to metals, uranium and electrification related themes going forward.
Every day over the last two months I seem to ask myself what is the latency of economic degradation that will result from the closure of the Strait of Hormuz? These are issues not yet in the performance data. They are not those related to the “news” of a tweet which appear to drive trading desks that clear their positions by the end of the week. It leads me to wonder how many portfolio’s original assumptions are about to become largely irrelevant.
It is even possible to model the proforma performance post the seismic impact of the war with Iran ?